Over the course of 2023, I submitted applications for 189 job opportunities. For my troubles, I had two interviews and zero offers.
It’d be easy to chalk it up to a rough job market or despair my spotty resume (between grad school, the pandemic, and generally trying to manifest a career shift, the last several years do not look great!), but neither of those things helps me actually get a job. So I set myself the task of evaluating my applications based on the (little) information I had.
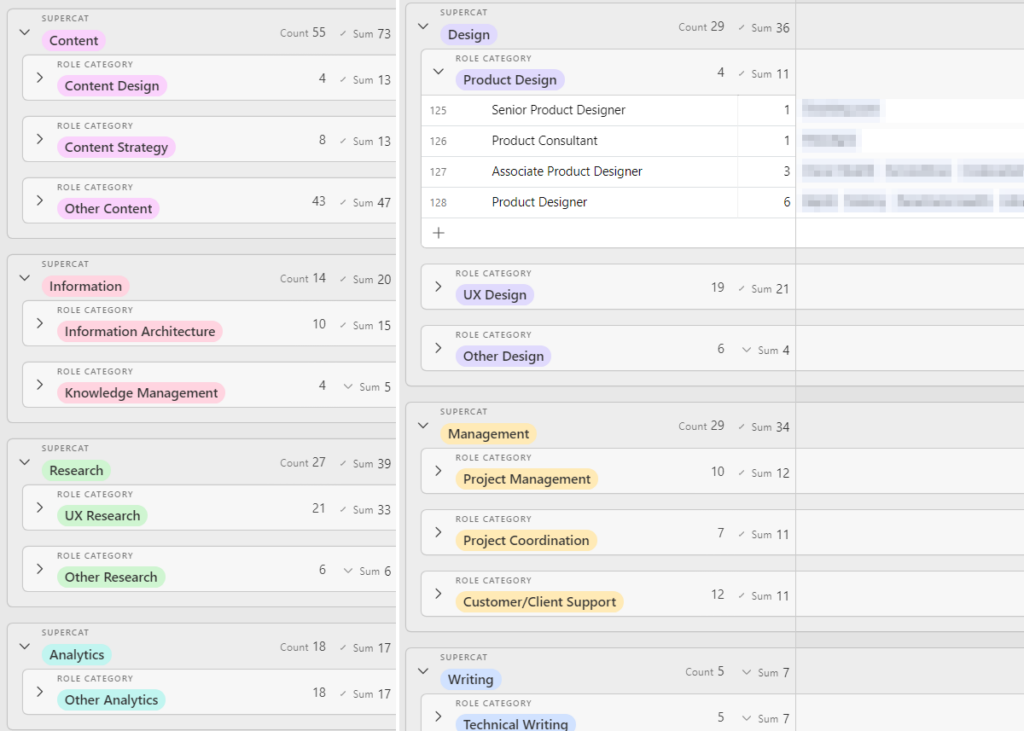
My first step was breaking down the data by Role. Of those 189 applications, there were 130(!) unique job titles, but many of them were similar roles, so I created an ad hoc classification system.

On the first pass, I started with labels that more or less matched the original job title—“Content Designer” and “Senior Content Designer” under Content Design; “UX/UI Designer” and “User Experience Designer” under UX Design, and so on. There were a few roles that didn’t quite fit easy boxes—Other Analytics and Other Content were a bit of a catch-all, but it was all right for a first pass.
Then I wanted to see if there were any conclusions I could draw about my applications and response patterns within those categories. Since my overall success rate (let’s say getting to the interview stage is a “success”) was negligible, I thought maybe I could see something in my rejection rate. I copied the grouped data into a spreadsheet just to make it a little easier on myself and calculated the percentage of explicit rejection responses for each role category to compare to the overall rejection rate. On doing so, I realized that most of the role categories represented too few applications to offer much insight, so I decided to group the categories into broader labels: Content, Information, Research, Analytics, Design, Writing, and Management.

Now, I don’t have any solid takeaways about explicit vs. assumed rejection across categories. Perhaps the hiring teams in some categories are more responsive than others. But there was a pattern, and that’s something to go on for my next steps.
With an overall explicit rejection rate of 40%, two categories were lower, two were higher, and one was about the same. (NB: these calculations reflect an earlier iteration of the “super category” breakdown.)
| Category | Explicit Rejection Rate |
| Content/Information (combined) | 32% of 79 applications |
| Research/Analysis (combined) | 60% of 47 applications |
| Design | 39% of 33 applications |
| Project Management | 47% of 15 applications |
| Support | 22% of 9 applications |
The higher explicit rejection categories suggest a need to better tailor my application materials for those roles, while an overall enhancement in matching my experience to job descriptions is clearly called for. I’ll go over how I’m approaching that process in another post.
Finally, someone reading this might be wondering: Emily, why are you applying for jobs in so many areas?! Just pick one thing and target it with gusto! Look. I’ve tried, OK? I am a square peg in a world of round holes. I’ve got a bunch of interesting, useful experiences, a semi-fancy graduate degree, and a whole lot of passion and willingness to just figure stuff out, but it doesn’t fit any one little box all that well. Am I a designer? Well, sure, in some respects. Researcher? I think I fit the requirements in some places; less so in others. Content strategist? With some very particular experiences, yeah! There’s nothing universal about the way these positions are described or advertised. I’m just a person with a pretty good brain I’d like to put to good use—in exchange for money so I can live my life. So I’ll probably continue to cast a wider net… just maybe with somewhat more specialized fishing equipment, so to speak.